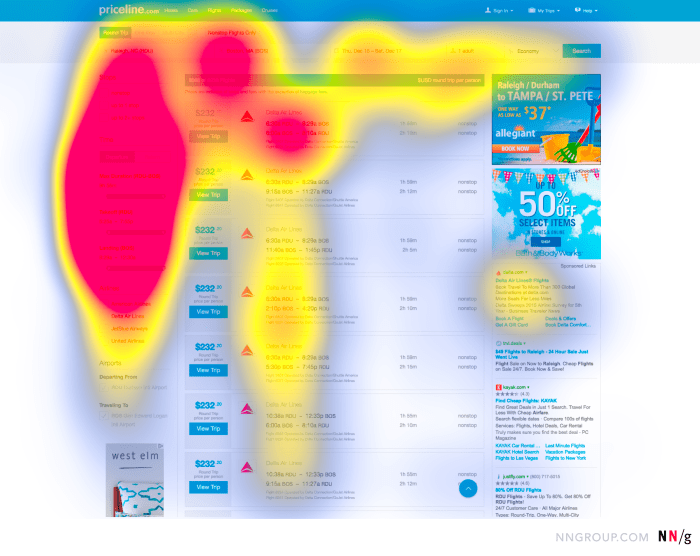
Using Heatmaps for UX opens the door to a world of design insights, where data visualization becomes the key to understanding user behavior and improving websites and applications. Dive into the realm of heatmaps and discover how they revolutionize the way we approach user experience design.
Introduction to Heatmaps for UX

Heatmaps are visual representations of data that show the intensity of user interaction on a website or application. In UX design, heatmaps are used to analyze how users engage with a digital product, identify patterns, and make informed design decisions to enhance the user experience.
Types of Heatmaps
- Click Heatmaps: These heatmaps display where users click the most on a webpage, helping designers understand which elements are getting the most attention.
- Scroll Heatmaps: Scroll heatmaps show how far down a page users scroll before leaving, allowing designers to optimize content placement for better engagement.
- Move Heatmaps: These heatmaps track mouse movements, indicating areas of interest and potential sources of confusion for users.
Benefits of Using Heatmaps, Using Heatmaps for UX
- Visual Data Interpretation: Heatmaps provide a visual representation of user behavior, making it easier for designers to identify trends and make data-driven design decisions.
- Identifying Hotspots: By highlighting areas of high user activity, heatmaps help prioritize design changes to improve the most frequented sections of a website or application.
- User Experience Optimization: Analyzing heatmaps allows designers to optimize user flow, improve navigation, and enhance overall user experience by addressing pain points and areas of low engagement.
Types of Heatmaps

Heatmaps are powerful tools in UX analysis, providing valuable insights into user behavior. There are several types of heatmaps commonly used in this field, each serving a specific purpose and offering unique benefits.
Click Heatmaps
Click heatmaps track where users click on a webpage, displaying hotspots where the most interactions occur. These heatmaps are valuable for understanding user engagement and identifying popular areas on a page. For example, an e-commerce website can use click heatmaps to determine which products are receiving the most clicks, helping optimize the layout for better user experience.
Scroll Heatmaps
Scroll heatmaps show how far down a webpage users scroll before losing interest or navigating away. By visualizing scrolling behavior, designers can identify the optimal placement of important content to ensure it is seen by users. For instance, a content-heavy website can use scroll heatmaps to determine if users are missing key information due to insufficient scrolling, prompting adjustments to enhance visibility.
Move Heatmaps
Move heatmaps track the movement of the mouse cursor on a webpage, highlighting areas of interest or confusion based on hover patterns. These heatmaps are useful for analyzing user attention and determining which elements attract the most interaction. A SaaS platform can utilize move heatmaps to assess user engagement with various features, guiding decisions on interface improvements for enhanced usability.
Creating Heatmaps
When it comes to creating heatmaps for UX research, it’s important to follow a systematic process to ensure accurate data collection and interpretation. Let’s dive into the step-by-step guide on how to set up and generate heatmaps using popular tools like Hotjar, Crazy Egg, or Google Analytics.
Setting Up Heatmaps
To create heatmaps, you first need to install a heatmap tool like Hotjar, Crazy Egg, or set up heatmap tracking in Google Analytics. Once the tool is set up, you can start generating heatmaps for your website or app.
- Log in to your heatmap tool account and navigate to the dashboard.
- Select the website or app you want to create a heatmap for.
- Choose the type of heatmap you want to generate (click, move, scroll, etc.).
- Set the parameters for the heatmap, such as time frame and specific pages to track.
- Generate the heatmap and analyze the results.
Ensure that you have enough traffic on your website or app to generate meaningful data for the heatmaps.
Best Practices for Heatmaps
When creating heatmaps, it’s essential to follow best practices to ensure accurate data collection and interpretation.
- Ensure that the heatmap tool is implemented correctly on all pages of your website or app.
- Regularly check and update the heatmap settings to capture relevant data.
- Combine heatmap data with other UX research methods for a comprehensive analysis.
- Consider user behavior patterns and trends when interpreting heatmap data.
- Regularly review and analyze heatmap results to identify areas for improvement.
Interpreting Heatmap Data: Using Heatmaps For UX
When it comes to analyzing and interpreting heatmap data, it’s essential to look beyond just the colors and focus on the patterns and insights they reveal about user behavior on your website. By understanding these data points, you can make informed decisions to improve the overall user experience.
Common Patterns and Insights
- Areas of High Interaction: Bright red or hot spots on a heatmap indicate areas where users are most active, clicking, or engaging with content. These areas are crucial as they show what users find most interesting or valuable on your site.
- Areas of Low Engagement: Cool or blue areas on a heatmap signify regions where users are less engaged or interacting minimally. Identifying these areas can help pinpoint potential issues or areas for improvement to increase user engagement.
- Scroll Depth: Heatmaps can also show how far users scroll down a page before losing interest. Understanding scroll behavior can assist in optimizing content placement and ensuring key information is visible without excessive scrolling.
Translating Data into Actionable Improvements
- Focus on Hotspots: Prioritize optimizing and enhancing areas of high interaction to further engage users and drive conversions. This could involve adding more compelling content, calls-to-action, or improving navigation.
- Address Cold Spots: Investigate areas of low engagement to identify potential issues such as confusing layouts, irrelevant content, or broken links. By addressing these issues, you can create a more seamless user experience.
- Iterative Testing: Use heatmap data to inform A/B testing and design iterations. Test different variations based on heatmap insights to continually refine and enhance the user experience over time.


