Get ready to dive into the world of stock quotes where numbers and symbols come alive. Understanding how to read a stock quote is like deciphering a secret language that holds the key to the financial markets. So, buckle up and let’s unravel the mystery together.
In this guide, we’ll break down the components of a stock quote, decode stock prices, analyze stock volume, and decipher stock market indices to equip you with the knowledge needed to navigate the complex world of investing.
Understanding Stock Quotes
When it comes to investing in the stock market, understanding stock quotes is essential. A stock quote provides valuable information about a particular stock’s performance, helping investors make informed decisions. Let’s break down the components of a stock quote and delve into why they are important.
Components of a Stock Quote
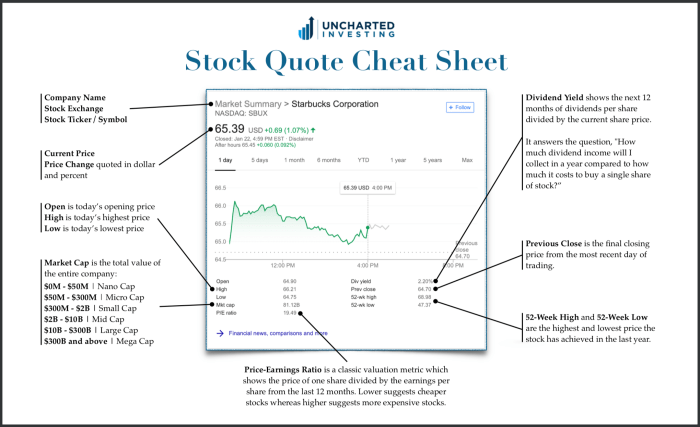
- The stock symbol: This is a unique set of letters representing a specific company’s stock. For example, AAPL stands for Apple Inc.
- Stock price: This is the current price at which a share of the stock is trading in the market.
- Change: This indicates how much the stock price has changed compared to the previous trading day.
- Volume: This shows the total number of shares traded during a specific period.
- Market cap: This represents the total value of a company’s outstanding shares in the market.
Importance of Stock Quotes for Investors
- Helps investors track the performance of their investments in real-time.
- Provides insights into market trends and stock price movements.
- Enables investors to make informed decisions based on up-to-date information.
Popular Stock Symbols and Meanings
- AAPL: Apple Inc.
- GOOGL: Alphabet Inc. (Google)
- MSFT: Microsoft Corporation
- AMZN: Amazon.com, Inc.
Interpreting Stock Prices
When looking at a stock quote, it’s important to understand how stock prices are displayed and what they represent. Stock prices are typically shown with a variety of numbers that can provide valuable information for investors.
Bid and Ask Prices
The bid price represents the highest price that a buyer is willing to pay for a stock at a given moment, while the ask price represents the lowest price that a seller is willing to accept. The difference between the bid and ask prices is known as the spread, and a smaller spread typically indicates higher liquidity in the market.
Opening, Closing, High, and Low Prices
– The opening price is the price at which a stock started trading at the beginning of the trading day.
– The closing price is the price at which a stock ended trading at the end of the trading day.
– The high price is the highest price that a stock reached during the trading day.
– The low price is the lowest price that a stock reached during the trading day.
Understanding these different prices can help investors gauge the overall movement and volatility of a stock throughout the trading day. It can also provide insights into market sentiment and potential future price movements.
Analyzing Stock Volume

When analyzing stock volume, we look at the number of shares traded in a particular stock over a specific period. This data is crucial because it indicates how actively a stock is being bought and sold by investors.
Volume impacts stock price movements because high volume usually indicates strong interest in a stock, leading to price movements in the same direction as the volume. On the other hand, low volume can suggest a lack of interest or uncertainty, leading to more stagnant price movements.
Representation of Volume in Stock Quote
- Volume is often represented in a stock quote as a number followed by “M” for million or “K” for thousand. For example, a volume of 1.5M means 1.5 million shares were traded.
- Some stock quotes may also show the average daily volume, which gives an idea of how the current trading volume compares to the typical volume for that stock.
- Charts can visually represent volume through bars or lines, showing spikes or dips in trading activity alongside price movements.
Deciphering Stock Market Indices
In the world of stock quotes, stock market indices play a crucial role in providing a snapshot of the overall market performance. These indices represent a specific segment of the stock market and help investors gauge the overall health and direction of the market.
Major Stock Market Indices and Abbreviations
- The Dow Jones Industrial Average (DJIA): Abbreviated as DJIA, this index tracks the performance of 30 large, publicly-owned companies in the United States.
- The S&P 500: The Standard & Poor’s 500, abbreviated as S&P 500, measures the performance of 500 large companies listed on stock exchanges in the United States.
- The NASDAQ Composite: Represented as NASDAQ, this index includes over 2,500 common stocks listed on the NASDAQ stock exchange.
Influence of Stock Market Indices on Individual Stock Quotes
Stock market indices serve as benchmarks that investors use to compare the performance of individual stocks to the overall market. When a stock is mentioned as being “up” or “down” in the news, it’s often in relation to how it’s performing compared to these major indices. For example, if the S&P 500 is showing a positive trend, individual stock prices may also rise in response to the overall market sentiment. On the flip side, a dip in the DJIA might signal caution for investors, impacting the prices of individual stocks as well.


