Dive into the world of Google Analytics Guide, where website tracking becomes a breeze. From setting up to interpreting reports, this guide has got you covered with all the insights you need.
Get ready to boost your website’s performance and understand your audience like never before.
Introduction to Google Analytics: Google Analytics Guide

Google Analytics is a powerful tool used to track and analyze website traffic. It provides valuable insights into user behavior, helping website owners make informed decisions to improve their online presence.
Using Google Analytics is crucial for websites to understand their audience, optimize marketing strategies, and measure the effectiveness of their campaigns. By monitoring key metrics such as page views, bounce rate, and conversion rates, businesses can tailor their content and offerings to better meet the needs of their target audience.
Google Analytics was launched in November 2005 after Google acquired Urchin Software Corporation. Since then, it has become the most widely used web analytics service on the internet, offering a wide range of features and capabilities to help businesses succeed online.
Benefits of Google Analytics
- Track website traffic and user behavior
- Measure the effectiveness of marketing campaigns
- Optimize website performance and user experience
- Identify trends and opportunities for growth
Setting Up Google Analytics
To set up Google Analytics for a website, follow these steps:
Creating a Google Analytics Account
- Go to the Google Analytics website and sign in with your Google account.
- Click on “Start measuring” and follow the prompts to set up your account.
- Enter your website information and get your tracking ID.
Configuring Tracking Codes
When configuring tracking codes, make sure to:
- Place the tracking code in the header of every page on your website.
- Use Google Tag Manager for easier management of tracking codes.
- Set up goals and events to track specific interactions on your site.
Types of Google Analytics Accounts, Google Analytics Guide
There are different types of Google Analytics accounts available, such as:
- Standard Google Analytics account for tracking website data.
- Google Analytics 360 for enterprise-level analytics with advanced features.
- Google Analytics for Firebase for tracking mobile apps and web apps.
Navigating the Google Analytics Dashboard
Navigating the Google Analytics dashboard is crucial for understanding the performance of your website. It provides valuable insights into visitor behavior, traffic sources, and much more.
Main Components of the Google Analytics Dashboard
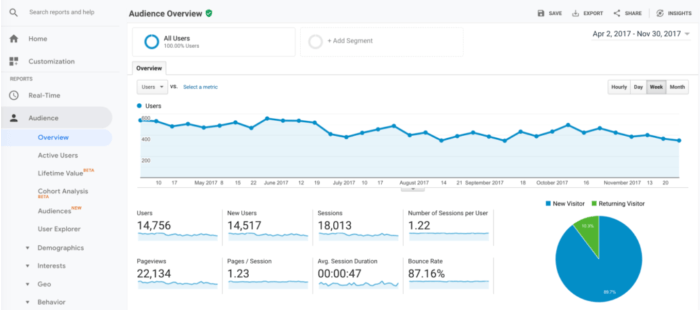
- The Audience Overview: This section gives you a snapshot of your website visitors, including metrics like sessions, users, bounce rate, and more.
- Traffic Sources: Here, you can see where your traffic is coming from, whether it’s organic search, social media, direct visits, or referrals.
- Behavior Flow: This feature shows the path visitors take through your site, helping you identify popular pages and potential bottlenecks.
Key Metrics and their Significance on the Dashboard
- Sessions: The number of times users are active on your site. It’s a good indicator of overall site traffic.
- Pageviews: The total number of pages viewed on your site. This metric helps you understand which pages are popular.
- Bounce Rate: The percentage of single-page sessions. A high bounce rate may indicate that visitors are not engaging with your content.
Customizing the Dashboard for Specific Needs
To customize the Google Analytics dashboard to suit your specific needs, you can:
- Click on “Customization” in the main menu and select “Dashboards” to create a new dashboard.
- Add widgets like metrics, charts, or tables to your dashboard to focus on the data that matters most to you.
- Use filters to segment your data and get a more targeted view of your website performance.
Understanding Google Analytics Reports

When it comes to Google Analytics, understanding the various reports available is crucial for making informed decisions about your website’s performance. By analyzing reports like Audience, Acquisition, Behavior, and Conversions, you can gain valuable insights into your website visitors, where they come from, how they behave on your site, and whether they’re converting into customers.
Audience Report
The Audience Report in Google Analytics provides valuable information about your website visitors, including demographics, interests, and behavior. By analyzing this report, you can tailor your content and marketing strategies to better meet the needs of your target audience.
Acquisition Report
The Acquisition Report helps you understand how visitors find your website, whether through organic search, paid advertising, social media, or other channels. By analyzing this report, you can allocate your marketing budget more effectively and focus on channels that drive the most traffic and conversions.
Behavior Report
The Behavior Report shows how visitors interact with your website, including the most popular pages, the average time spent on each page, and the bounce rate. By analyzing this report, you can optimize your website for a better user experience and increase engagement and conversions.
Conversions Report
The Conversions Report tracks the actions visitors take on your website, such as making a purchase, signing up for a newsletter, or completing a form. By analyzing this report, you can identify areas of improvement in your conversion funnel and optimize your website for higher conversion rates.


