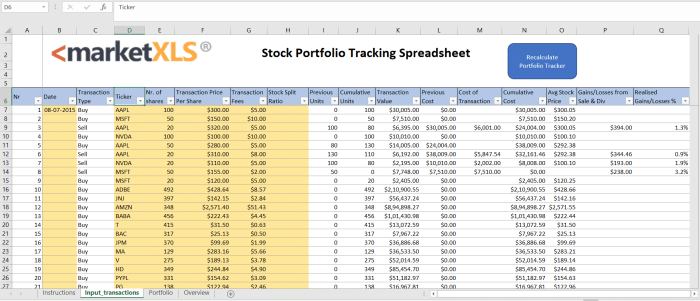
Stock Portfolio Analysis: With the world of investing at your fingertips, delving into the realm of stock portfolio analysis opens doors to strategic decision-making and financial success. Discover how analyzing your stock portfolio can lead to informed choices, risk reduction, and increased returns.
Get ready to explore the depths of fundamental and technical analysis, uncover the power of qualitative and quantitative evaluation methods, and unravel the key metrics that drive investment decisions. Brace yourself for a journey through the tools, software, and insights that shape the landscape of stock portfolio analysis.
Importance of Stock Portfolio Analysis
Stock portfolio analysis is crucial for investors looking to make informed decisions about their investments. By analyzing a stock portfolio, investors can assess the performance of their investments, identify strengths and weaknesses, and determine the best course of action to maximize returns and mitigate risks.
Mitigating Risks and Maximizing Returns
- One of the key benefits of stock portfolio analysis is the ability to mitigate risks. By diversifying investments across different sectors or asset classes, investors can reduce the impact of a downturn in any one particular stock or industry.
- Stock portfolio analysis also helps investors identify underperforming stocks or assets that may be dragging down overall returns. By reallocating funds from underperforming investments to better-performing ones, investors can optimize their portfolio and maximize returns.
- Furthermore, regular stock portfolio analysis allows investors to stay informed about market trends, economic indicators, and company performance. This information can help investors make strategic decisions about buying, selling, or holding onto investments based on changing market conditions.
Types of Stock Portfolio Analysis
When analyzing a stock portfolio, investors can utilize different types of analysis to evaluate their investments and make informed decisions. Two common approaches are fundamental analysis and technical analysis.
Fundamental Analysis
Fundamental analysis involves examining the financial health and performance of a company to determine its intrinsic value. This type of analysis looks at factors such as revenue, earnings, assets, liabilities, and growth potential. Some qualitative methods used in fundamental analysis include assessing the company’s management team, competitive advantage, and industry trends. On the other hand, quantitative methods involve analyzing financial statements, ratios, and valuation metrics.
Technical Analysis
Technical analysis focuses on studying past market data and price movements to forecast future price trends. This approach involves analyzing charts, patterns, and indicators to identify potential buying or selling opportunities. Some common quantitative methods used in technical analysis include moving averages, relative strength index (RSI), and support/resistance levels.
Pros and Cons
Fundamental Analysis
Pros
Provides a deeper understanding of a company’s financial health and long-term prospects. Helps investors make informed decisions based on intrinsic value.
Cons
Time-consuming process that requires extensive research and analysis. May not always account for short-term market fluctuations.
Technical Analysis
Pros
Helps identify short-term trading opportunities based on market trends and patterns. Utilizes historical data to predict potential price movements.
Cons
Relies heavily on historical data, which may not always accurately predict future price movements. Can be subjective and prone to interpretation errors.
Tools and Software for Stock Portfolio Analysis
When it comes to analyzing stock portfolios, having the right tools and software can make all the difference. These tools help investors track, manage, and evaluate their stock investments more effectively. Let’s take a look at some popular options and how they can assist in making informed decisions.
1. Yahoo Finance
Yahoo Finance is a widely used platform that provides a range of tools for stock analysis. Investors can track stock prices, create watchlists, and access detailed financial information on companies. The platform also offers customizable charts and graphs to visualize portfolio performance.
2. Morningstar
Morningstar is another popular tool that offers in-depth analysis of stocks and mutual funds. Investors can access research reports, analyst recommendations, and historical performance data. The platform also provides portfolio tracking and risk assessment tools to help investors make informed decisions.
3. Seeking Alpha, Stock portfolio analysis
Seeking Alpha is a platform that offers a mix of crowdsourced and professional analysis on stocks. Investors can access articles, stock recommendations, and earnings call transcripts to stay informed about market trends. The platform also allows users to create and track their stock portfolios.
4. Stock Rover
Stock Rover is a comprehensive stock analysis tool that offers screening, research, and portfolio management capabilities. Investors can use customizable metrics and filters to identify investment opportunities and track portfolio performance. The platform also provides detailed financial data and analysis tools for effective decision-making.
5. Bloomberg Terminal
Bloomberg Terminal is a powerful tool used by professional investors and traders for stock analysis. The platform offers real-time market data, news, and research reports from leading financial institutions. Investors can create custom alerts, analyze market trends, and execute trades directly through the platform.These tools provide a wide range of features to assist investors in analyzing, tracking, and managing their stock portfolios effectively.
By utilizing these tools, investors can make more informed decisions and optimize their investment strategies for better returns.
Key Metrics for Stock Portfolio Analysis

When it comes to analyzing stock portfolios, there are key metrics that investors use to make informed decisions. These metrics provide valuable insights into the performance and potential of the stocks in a portfolio. Let’s dive into some of the essential metrics used in stock portfolio analysis.
P/E Ratio (Price-to-Earnings Ratio)
The P/E ratio is a widely used metric that helps investors evaluate the valuation of a stock. It is calculated by dividing the current market price of a stock by its earnings per share (EPS). A high P/E ratio may indicate that a stock is overvalued, while a low P/E ratio could suggest that it is undervalued. Investors often use the P/E ratio to compare the valuations of different stocks within a portfolio and make decisions based on growth potential.
Beta
Beta is a metric that measures the volatility of a stock compared to the overall market. A beta of 1 indicates that the stock moves in line with the market, while a beta greater than 1 means the stock is more volatile than the market. On the other hand, a beta less than 1 suggests that the stock is less volatile.
Investors use beta to assess the risk associated with a particular stock and its impact on the overall portfolio performance.
Dividend Yield
Dividend yield is a metric that shows the annual dividend income as a percentage of the stock price. It helps investors understand how much income they can generate from holding a particular stock. A high dividend yield may indicate that a stock is undervalued or that the company is financially stable and generates consistent cash flow. Investors often look for stocks with a balance of dividend yield and growth potential to build a diversified portfolio.These key metrics play a crucial role in guiding investment decisions and assessing the performance of stock portfolios.
By understanding and effectively interpreting these metrics, investors can make informed choices to optimize their portfolios for long-term growth and success.


